Why do you care about a dashboard on PLC in Bursa Malaysia?
So why do you care about a dashboard on certain parameters of the Public Listed Companies (PLC) in Bursa Malaysia?
Perhaps on a company that you are invested in, or thinking of investing in.
Because if you believe a unit of share in the PLC represents a unit of ownership in that company, you would want to know how well that company is doing.
“Price is what you paid for, value is what you get.” — Warren Buffett.
If the Oracle is right, share price follows value over time.
Since the beginning of the year, Banking stocks have led the rally in Bursa Malaysia. The rally is fast and furious, and the buying is largely done by institutions—the so-called “smart money.”
Smart money only invests in good companies that are well managed, with good fundamentals.
Here is the price change for 10 banks listed in Bursa Malaysia year-to-date (YTD) as of February 11, 2026:
- Maybank: 16.98%
- CIMB: 4.12%
- Public Bank: 13.22%
- RHB: 5.06%
- Hong Leong Bank: 6.49%
- AmBank: -0.15%
- Affin Bank: 17.45%
- Alliance Bank: 5.74%
- MBSB: 4.96%
- Bank Islam Malaysia: 9.61%
It is clear some banks have had a better run than others, like Maybank and Bank Islam. Some already had a pretty good run last year, like AmBank, Alliance Bank, and CIMB. Others, like MBSB, are still lagging relatively speaking.
What the Dashboard Tells Us
Their KPI as displayed in the dashboard tells us why.
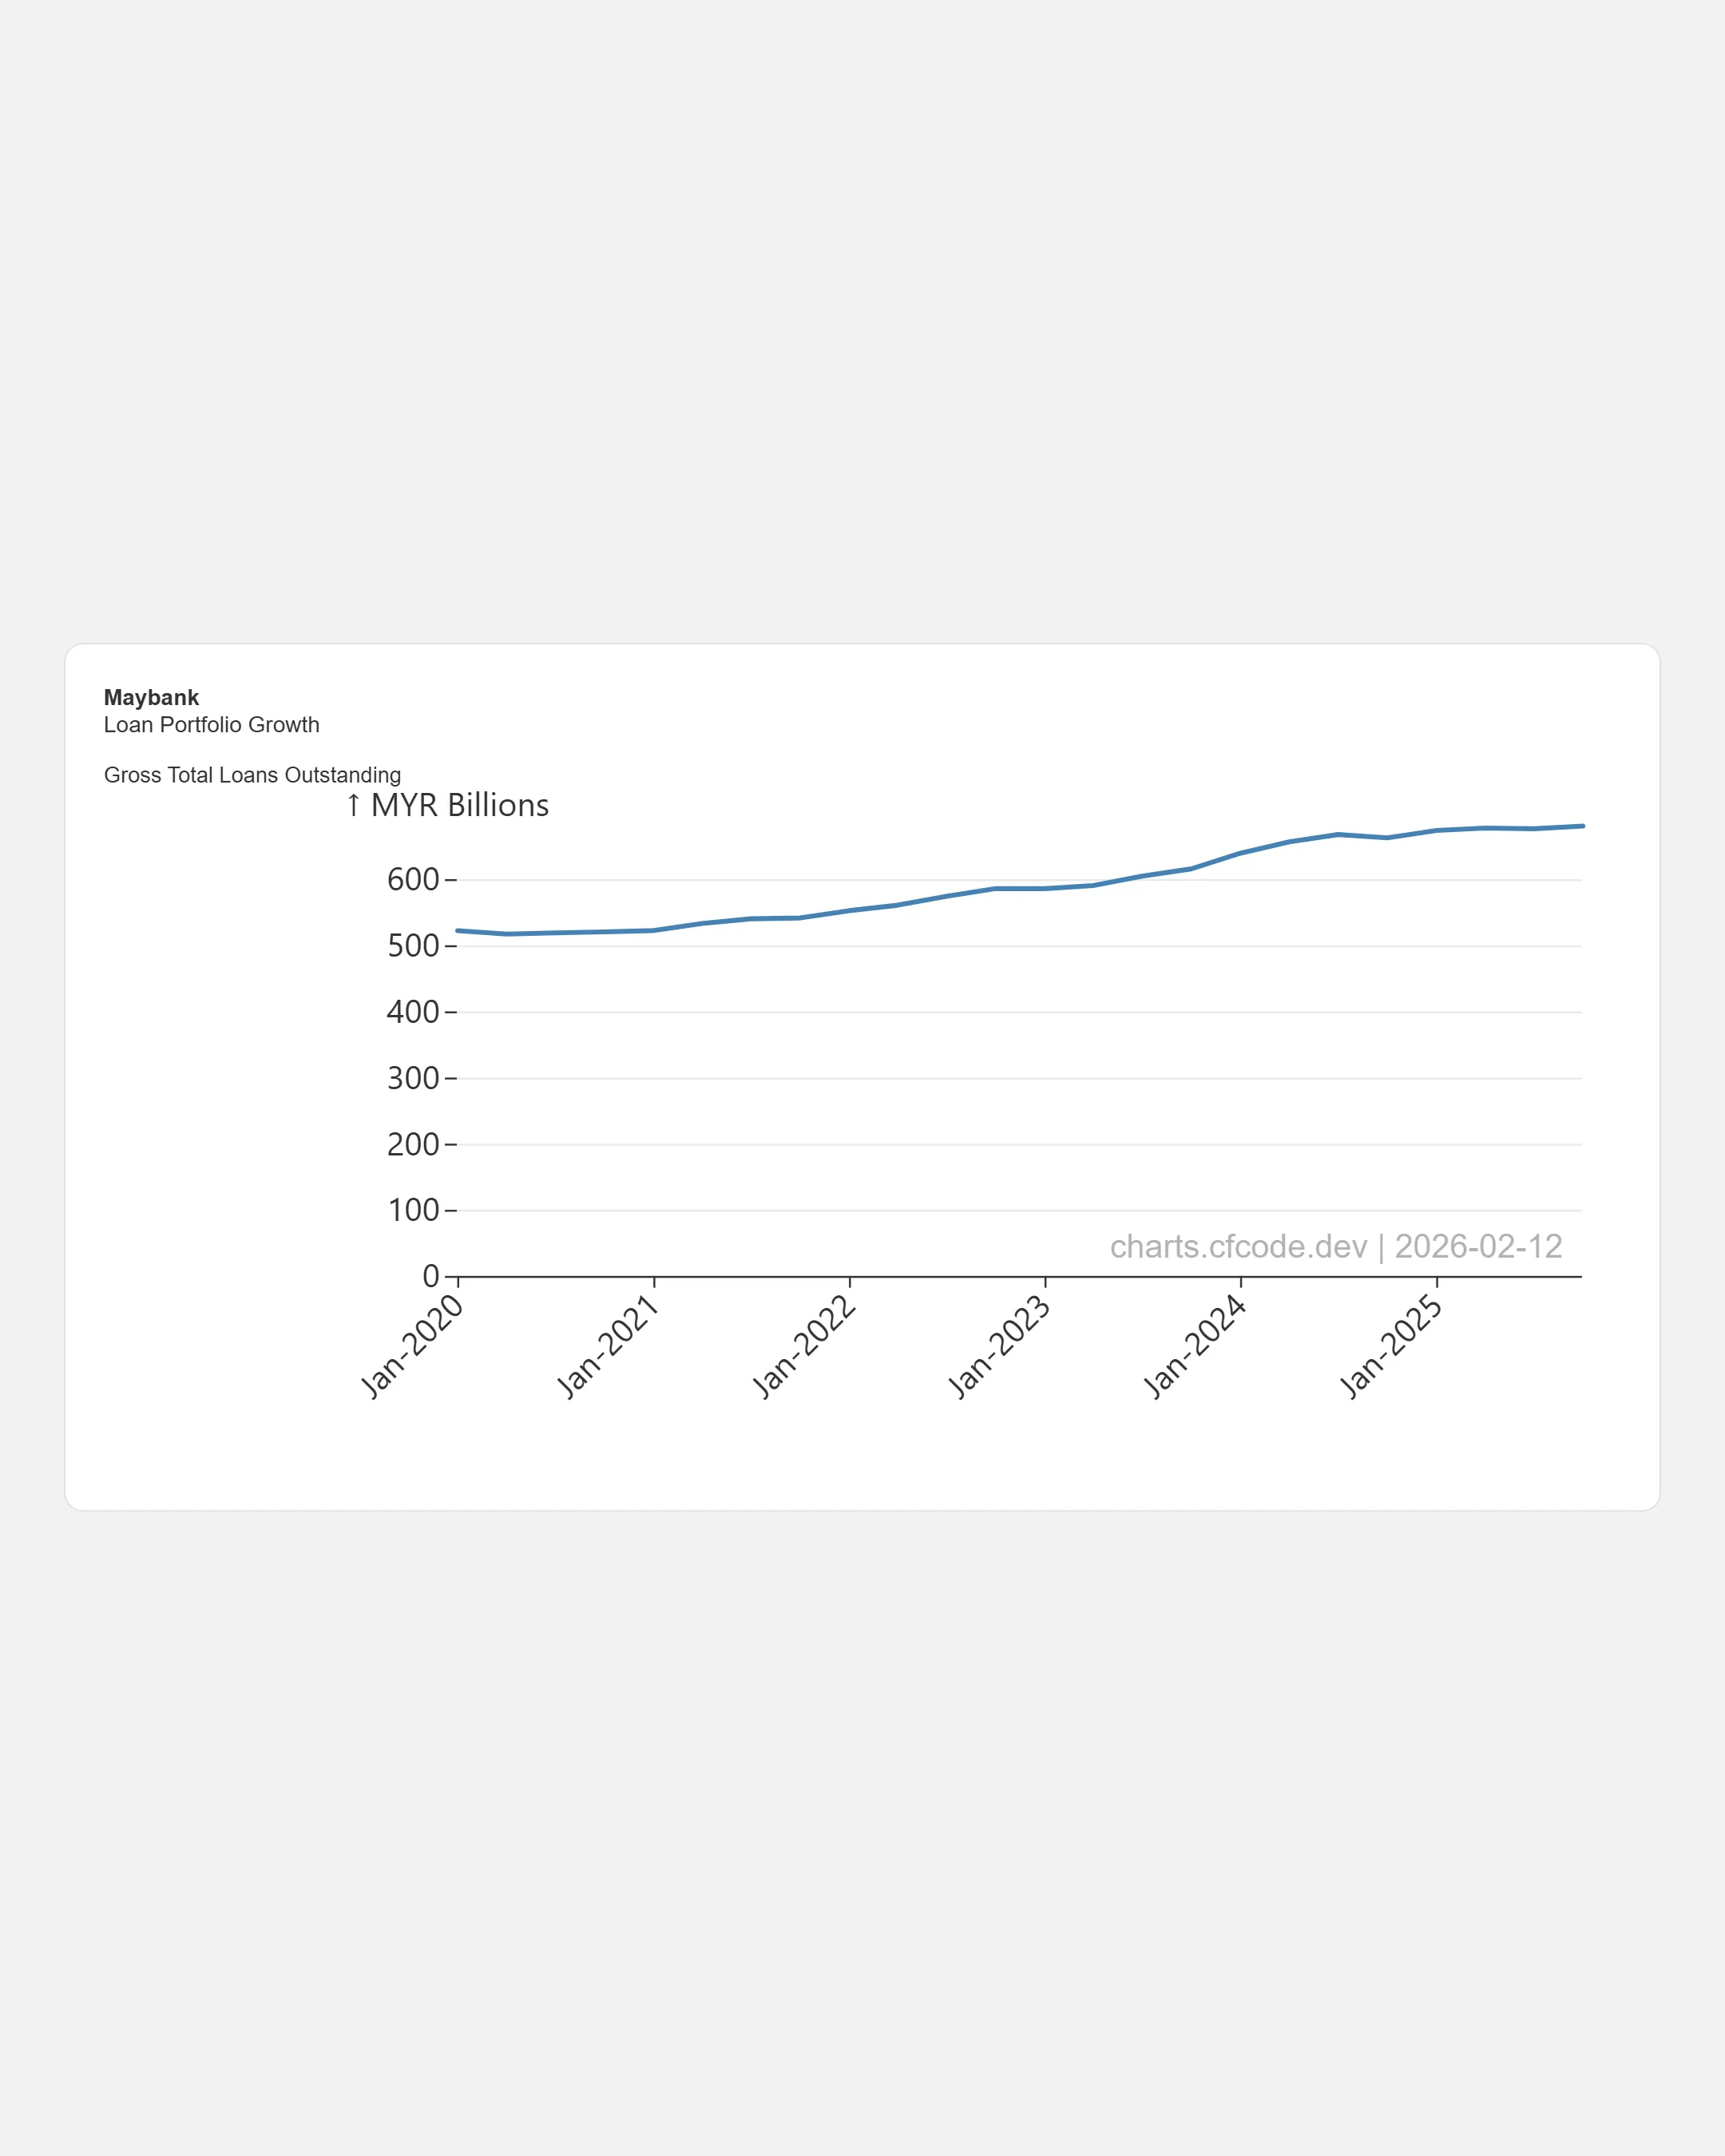
Maybank, the biggest bank in Malaysia by asset size, has been consistently growing its Net Income since the Covid years.
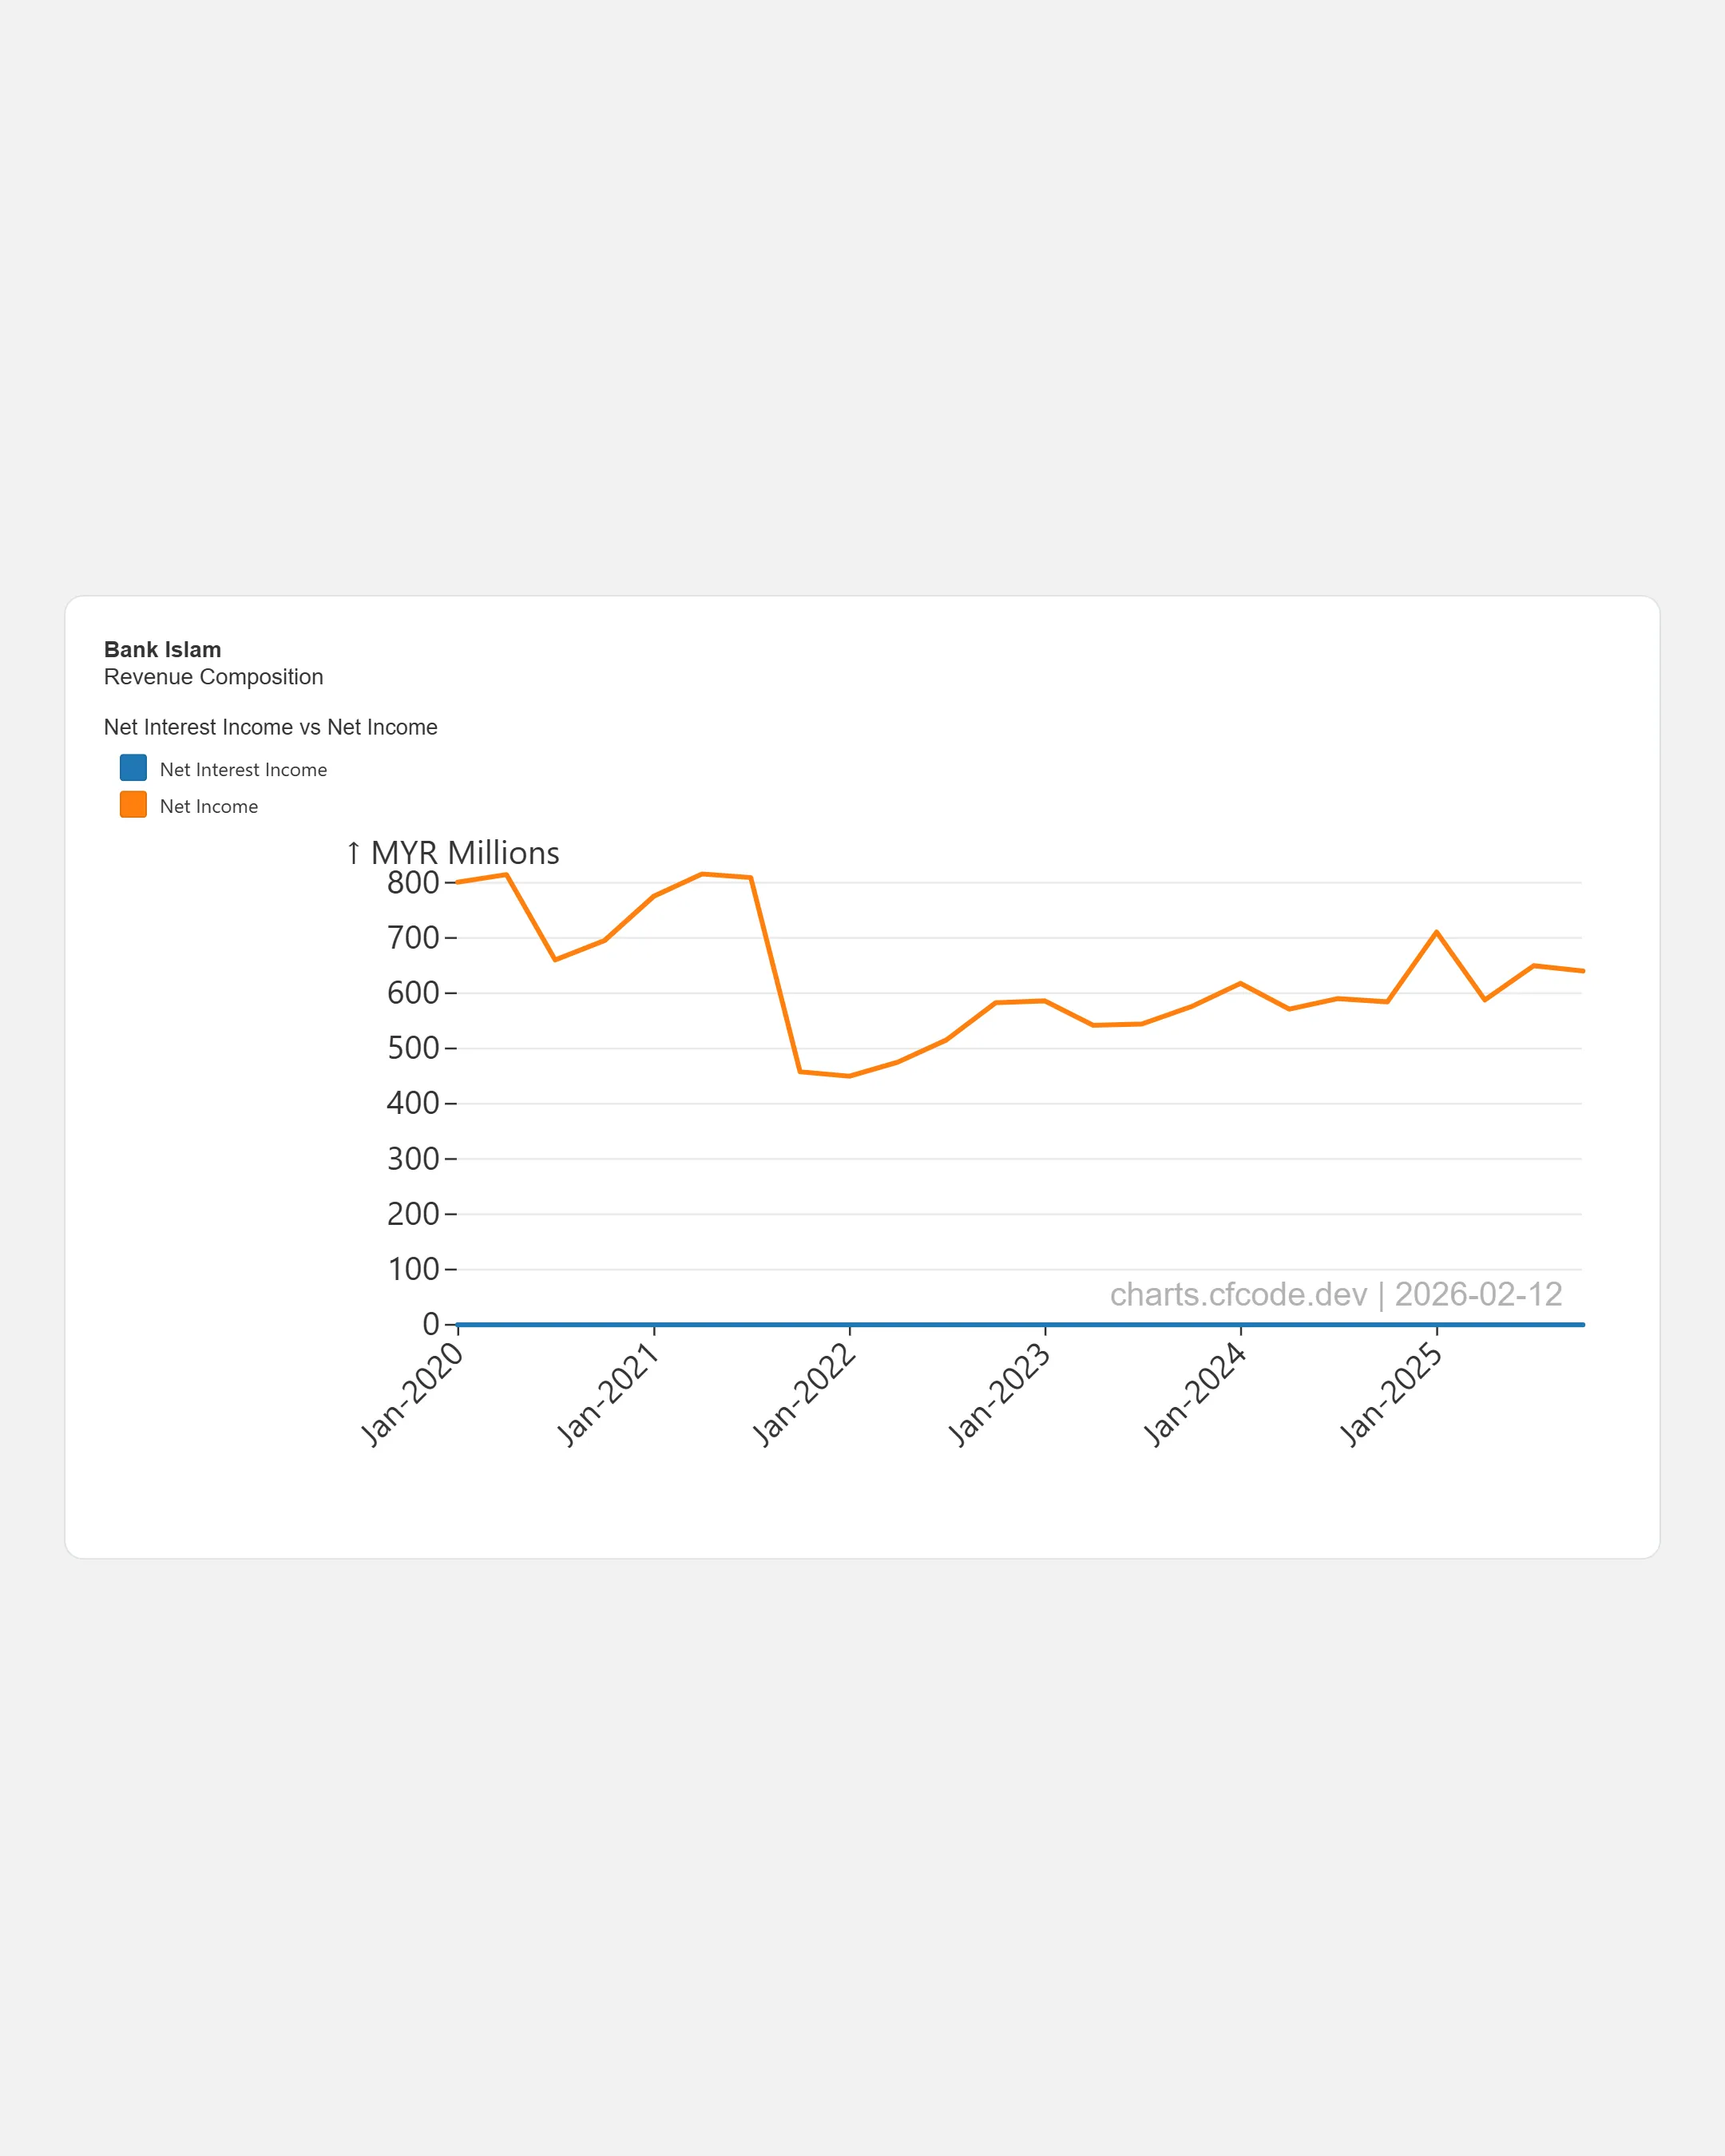
Bank Islam’s income has been trending up since 2022. More income means better ability to pay dividends to shareholders.
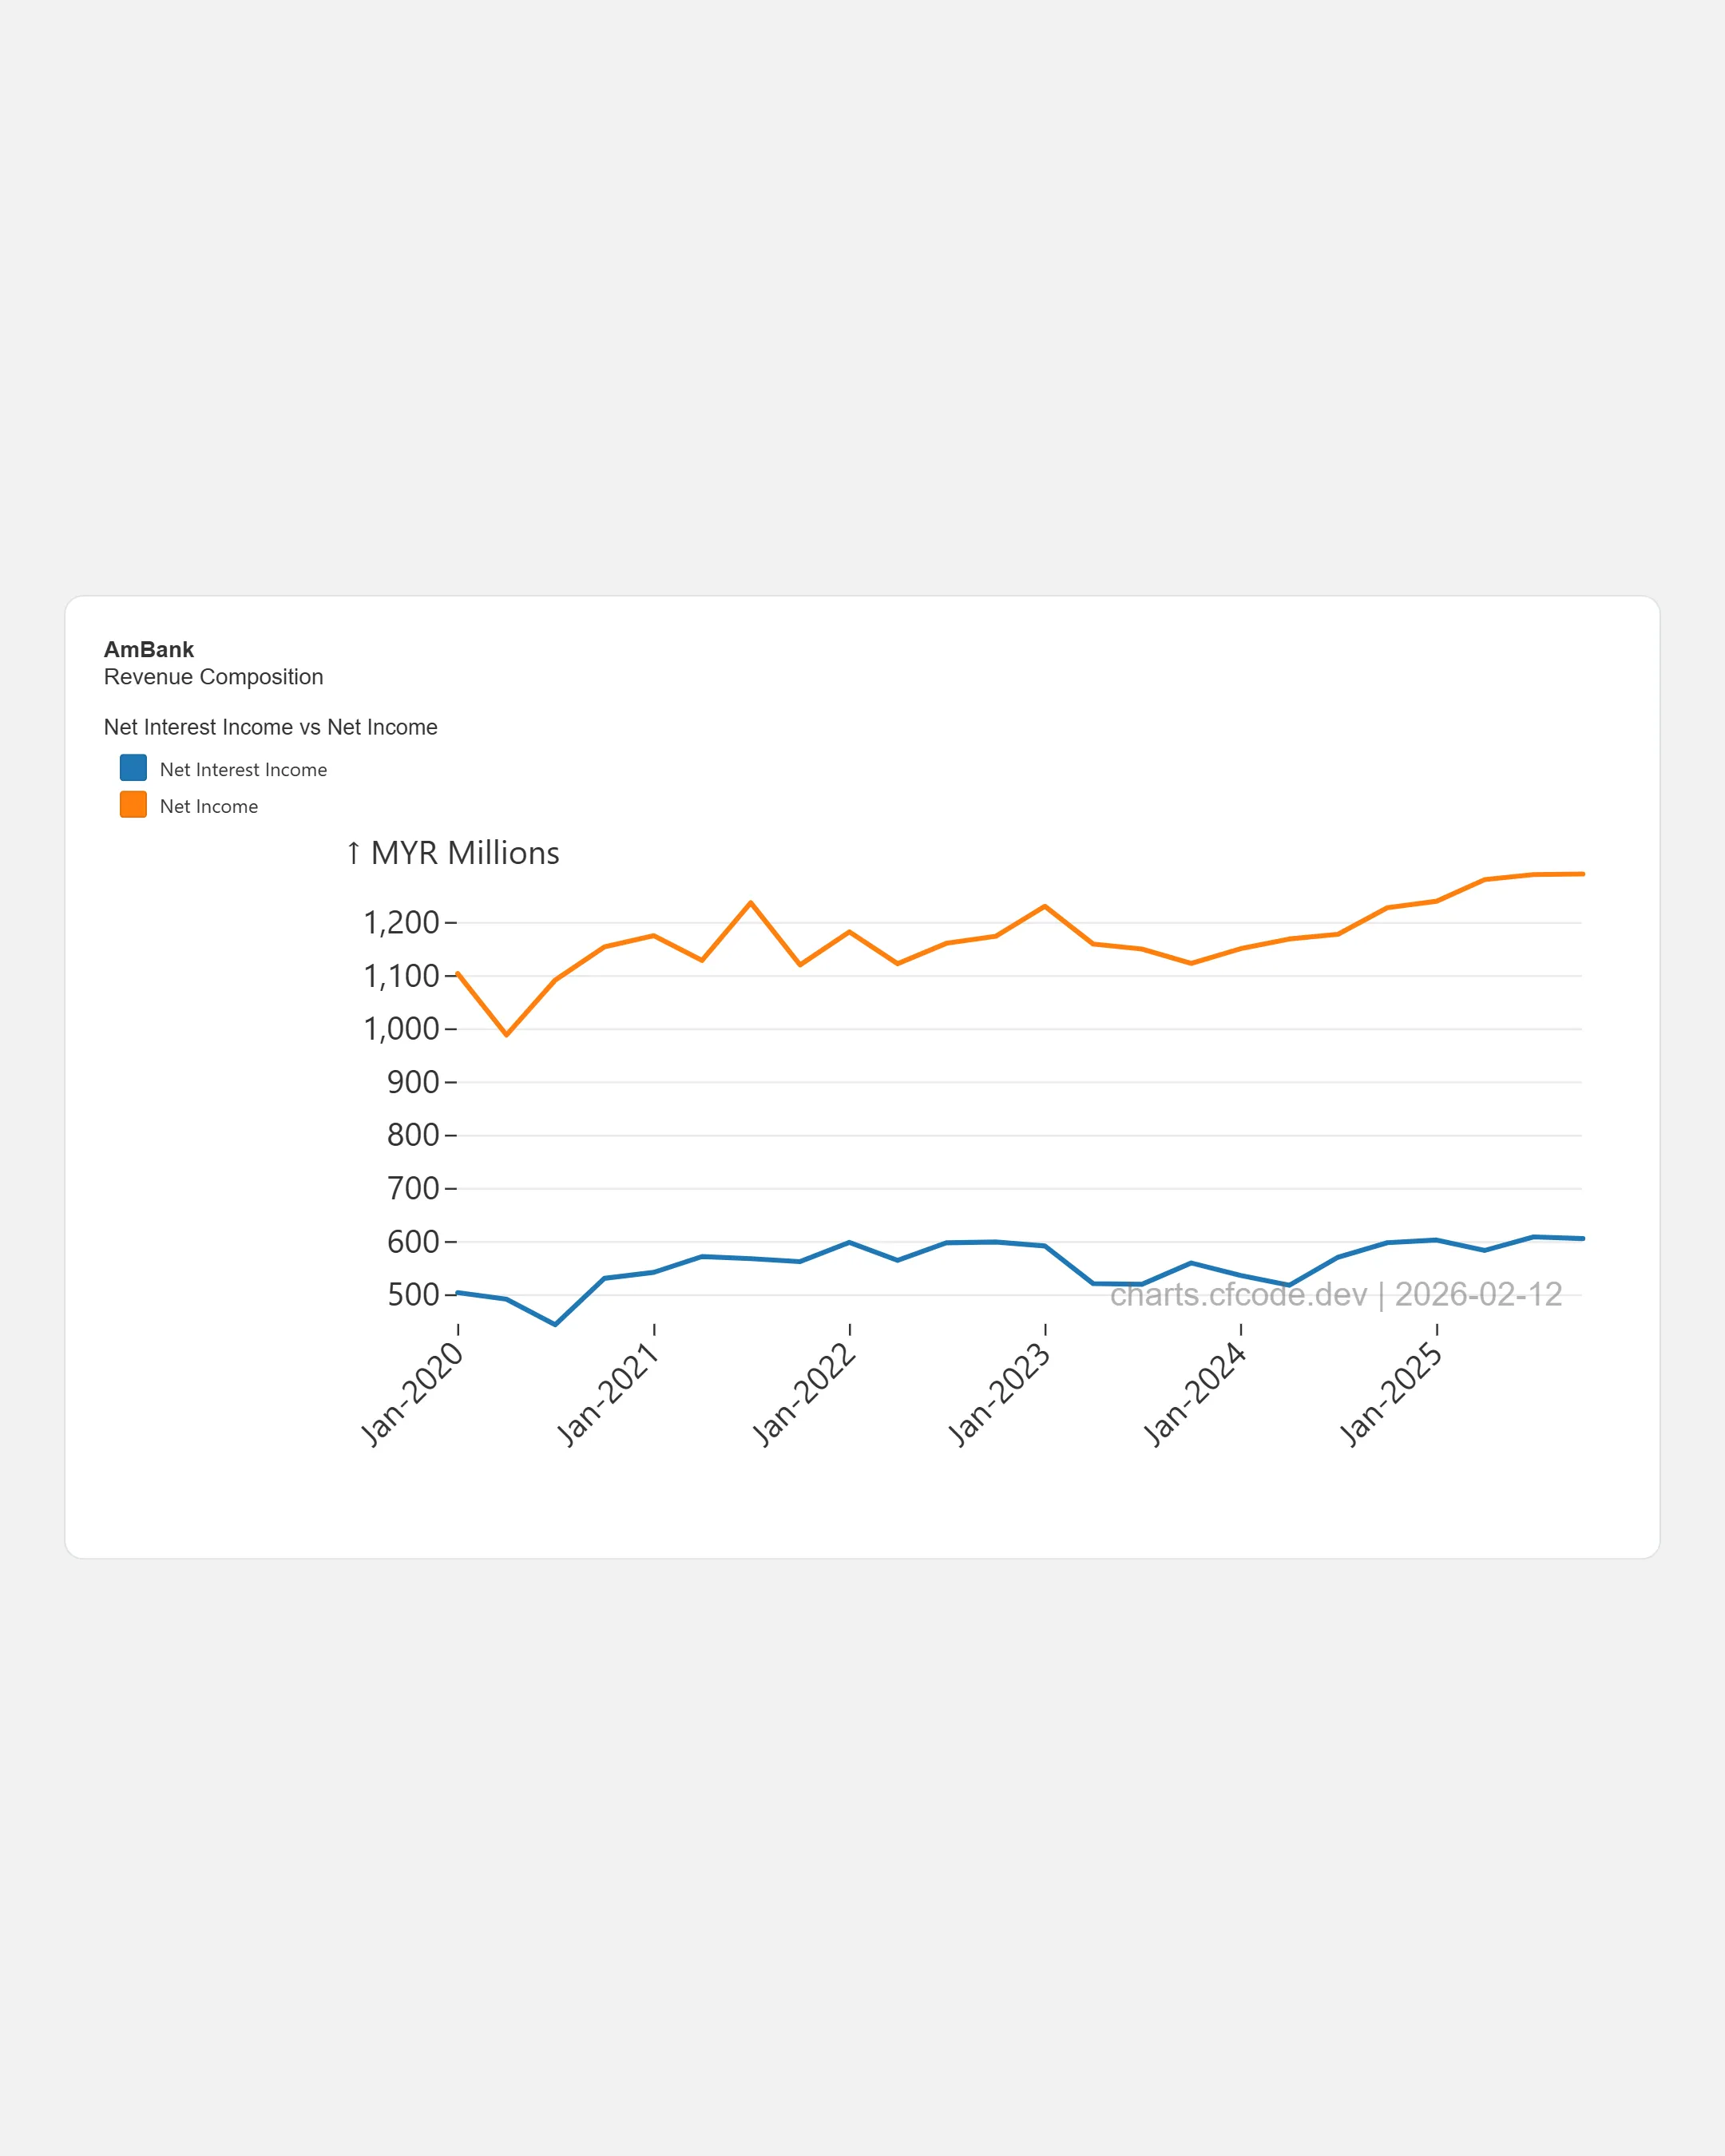
AmBank has seen its net income growing, despite the challenges it had with the 1MDB scandals. Now that is behind them, the bank can pay more dividends to shareholders going forward.
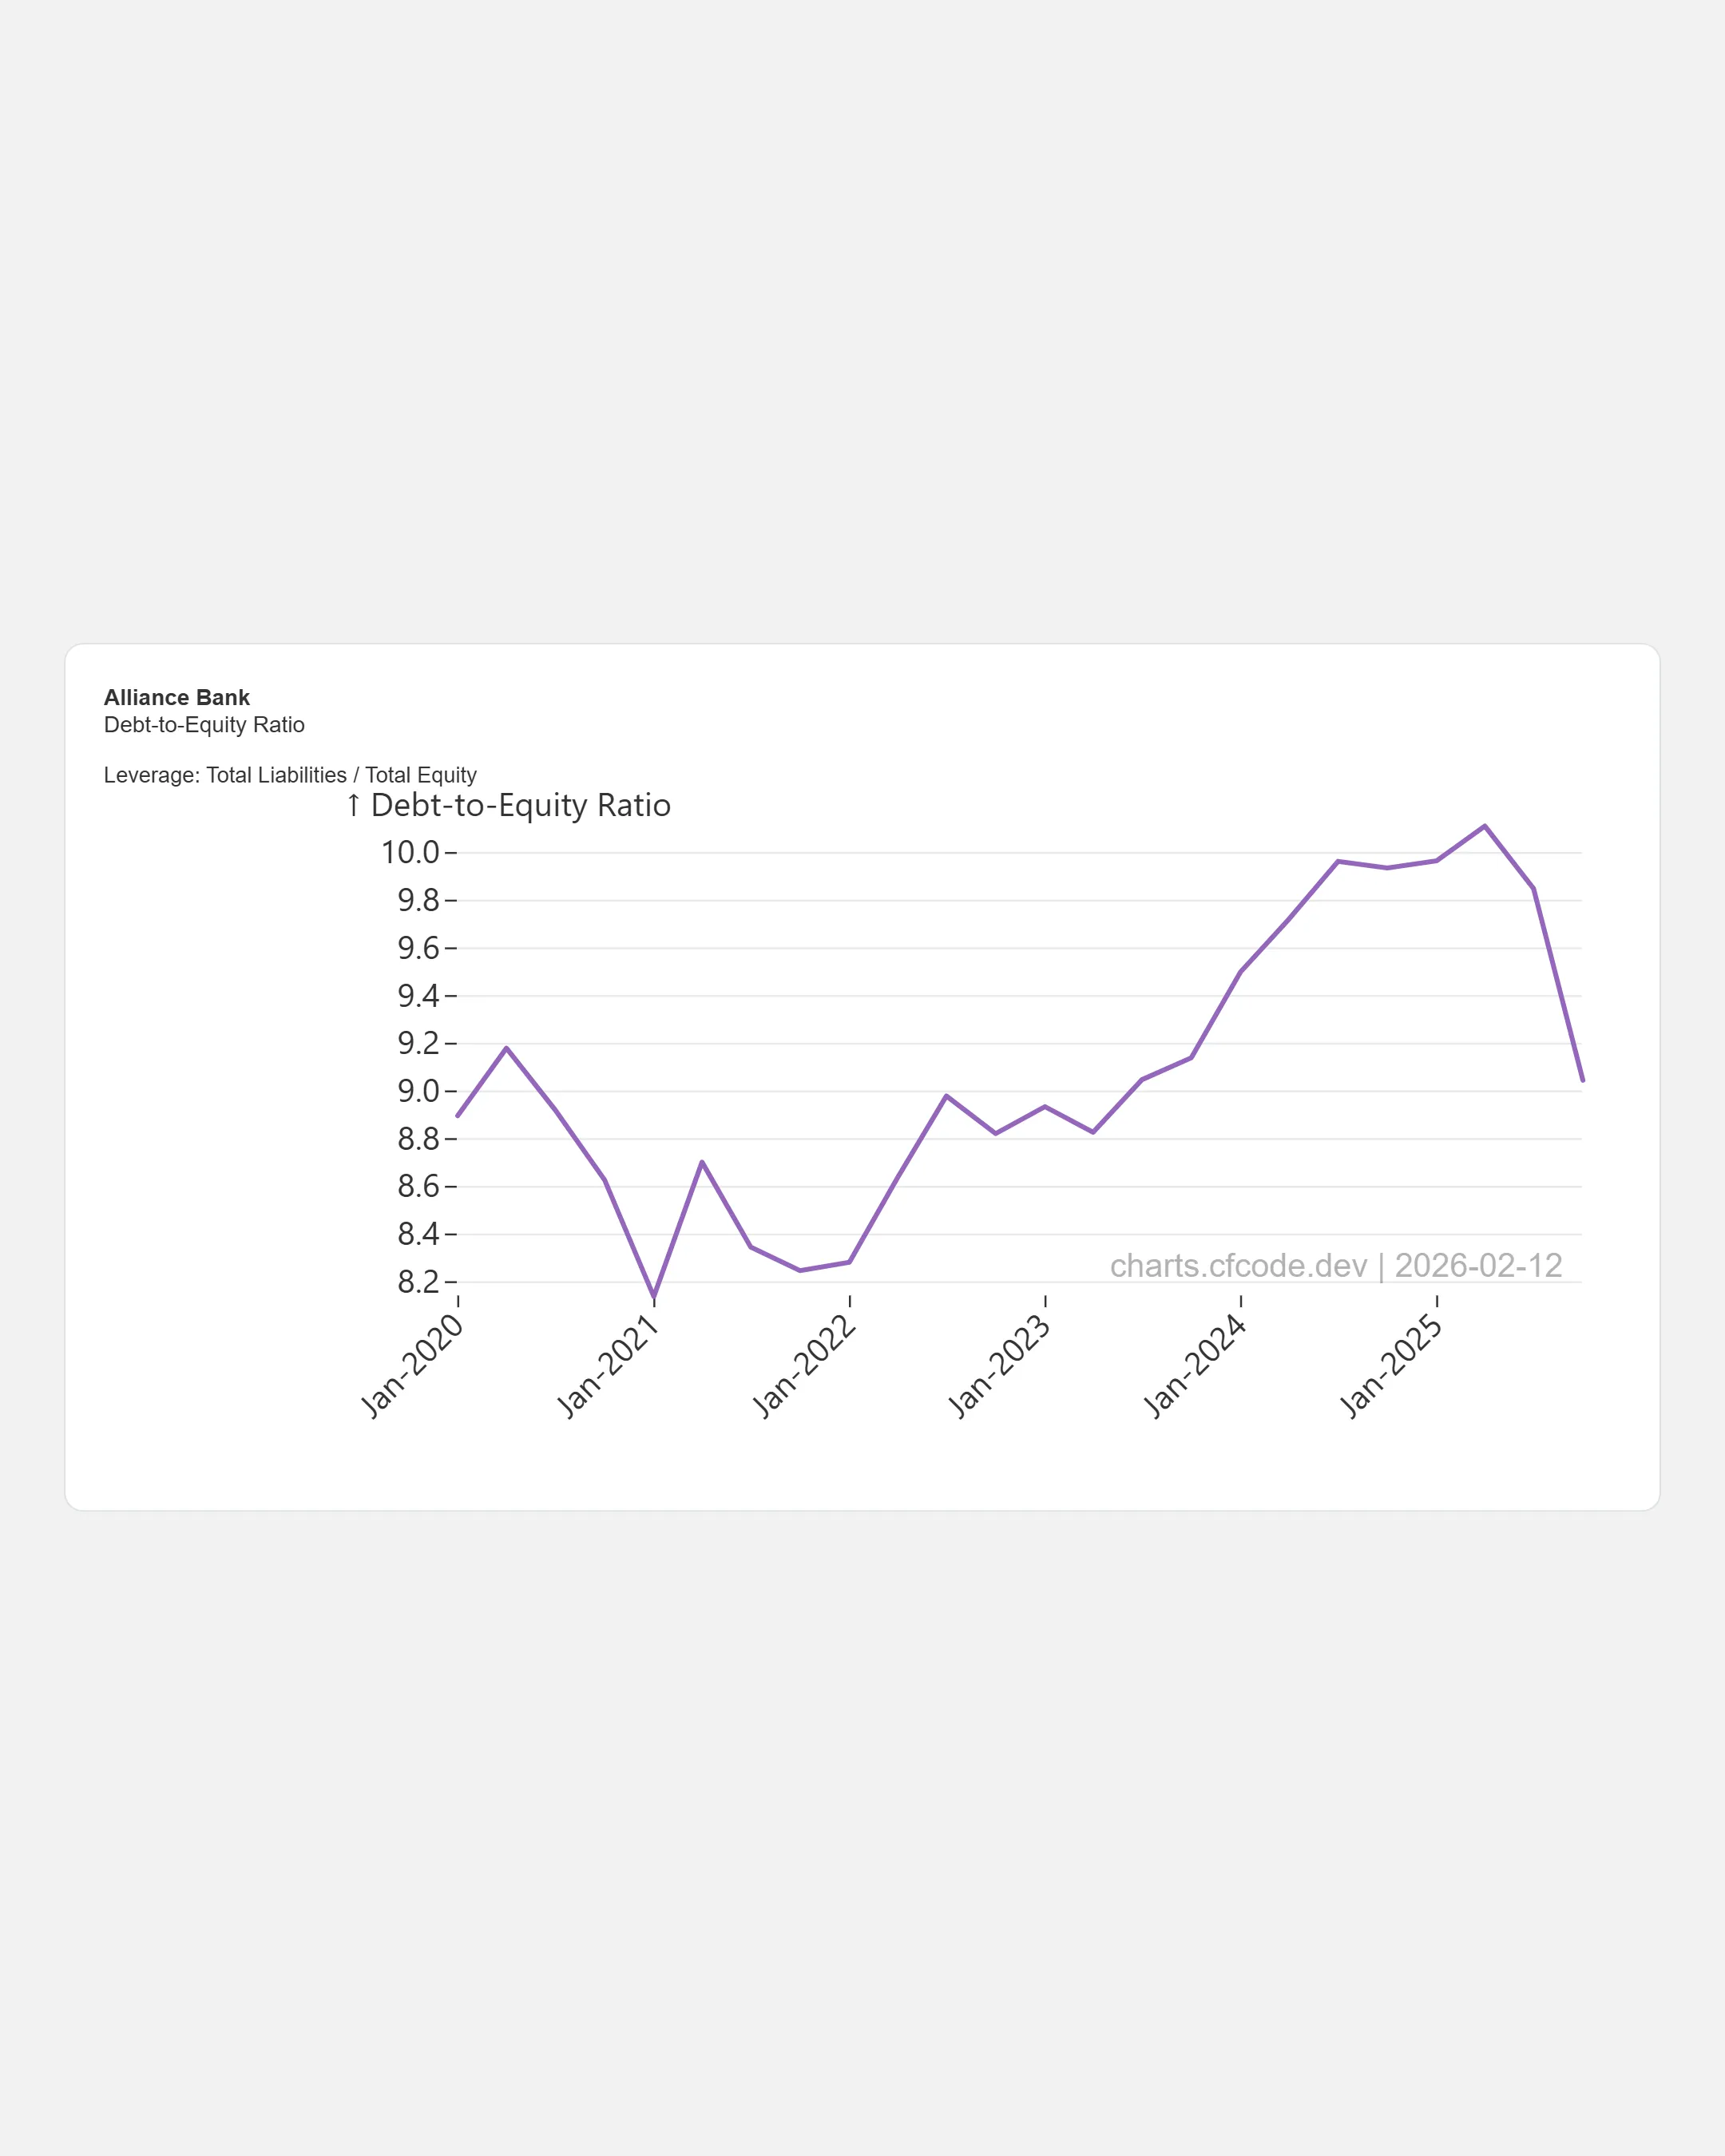
Alliance Bank has just completed its rights issue last year. The debt-over-equity ratio is pointing downwards, which means it can increase its leverage to grow its business further.
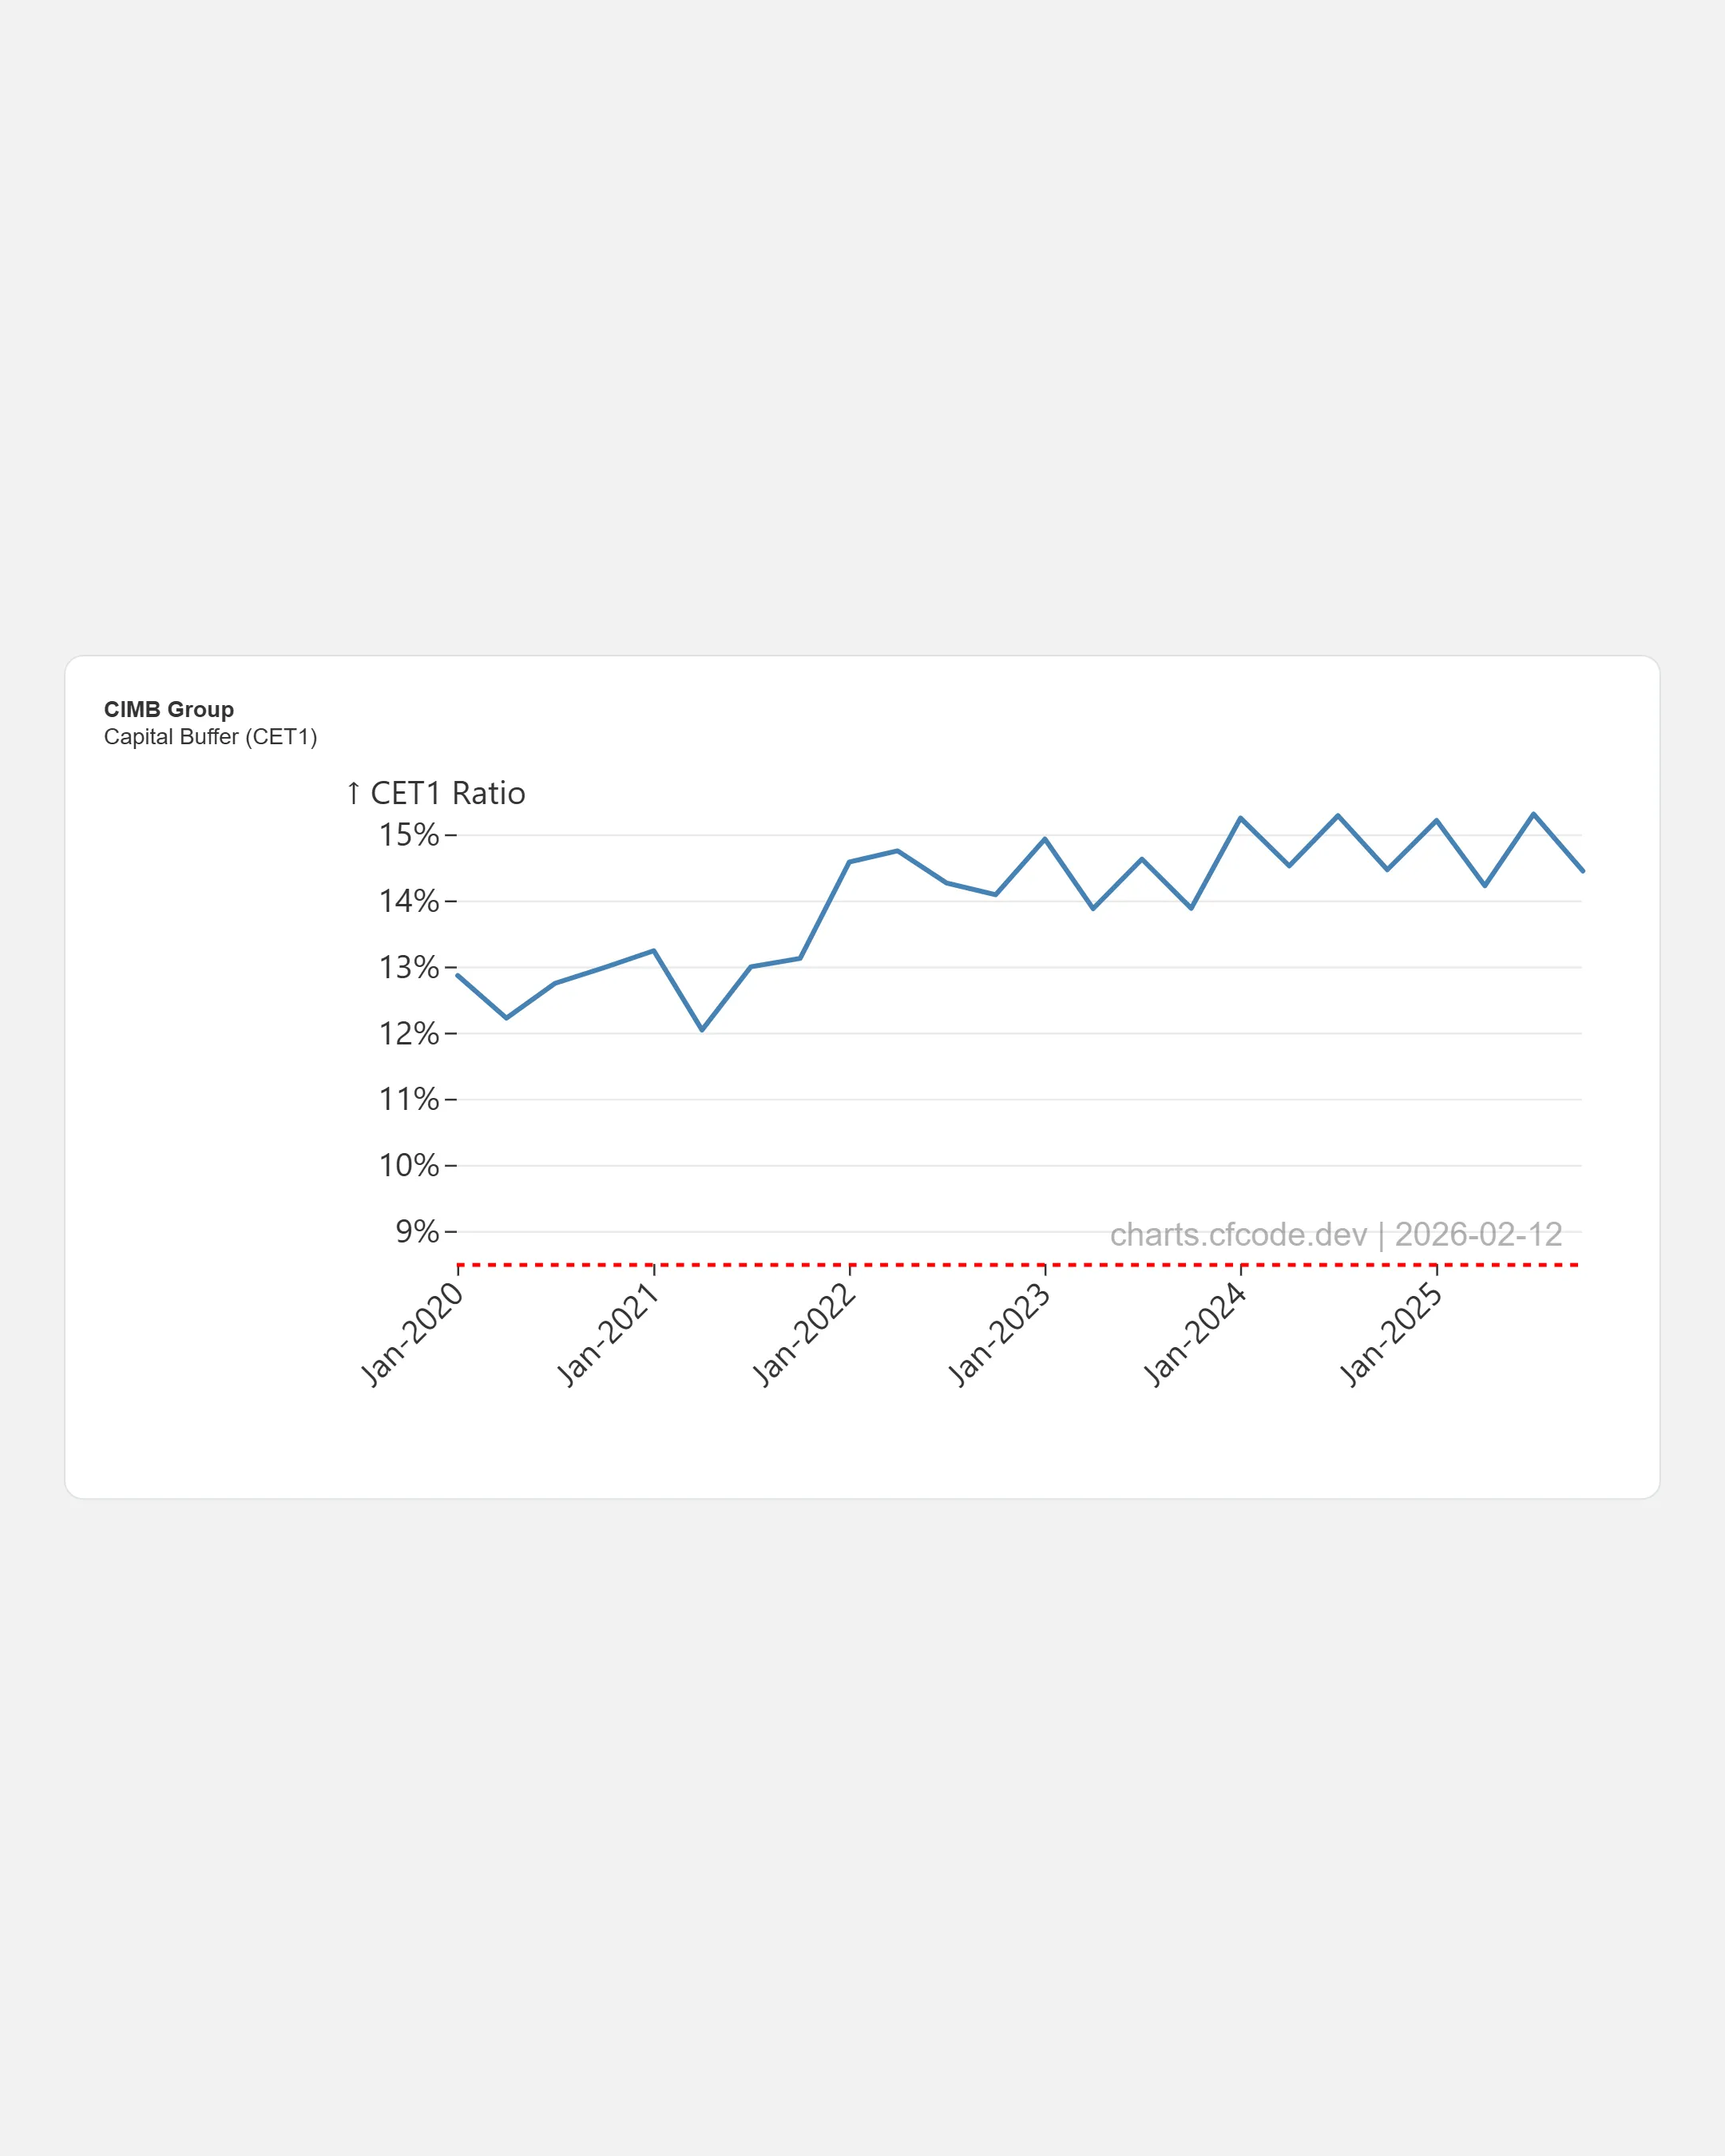
CIMB has one of the best CET1 Capital Ratios in the banking sector, which means it can reward shareholders with higher dividends or share buybacks going forward. In fact, they mentioned this last year.
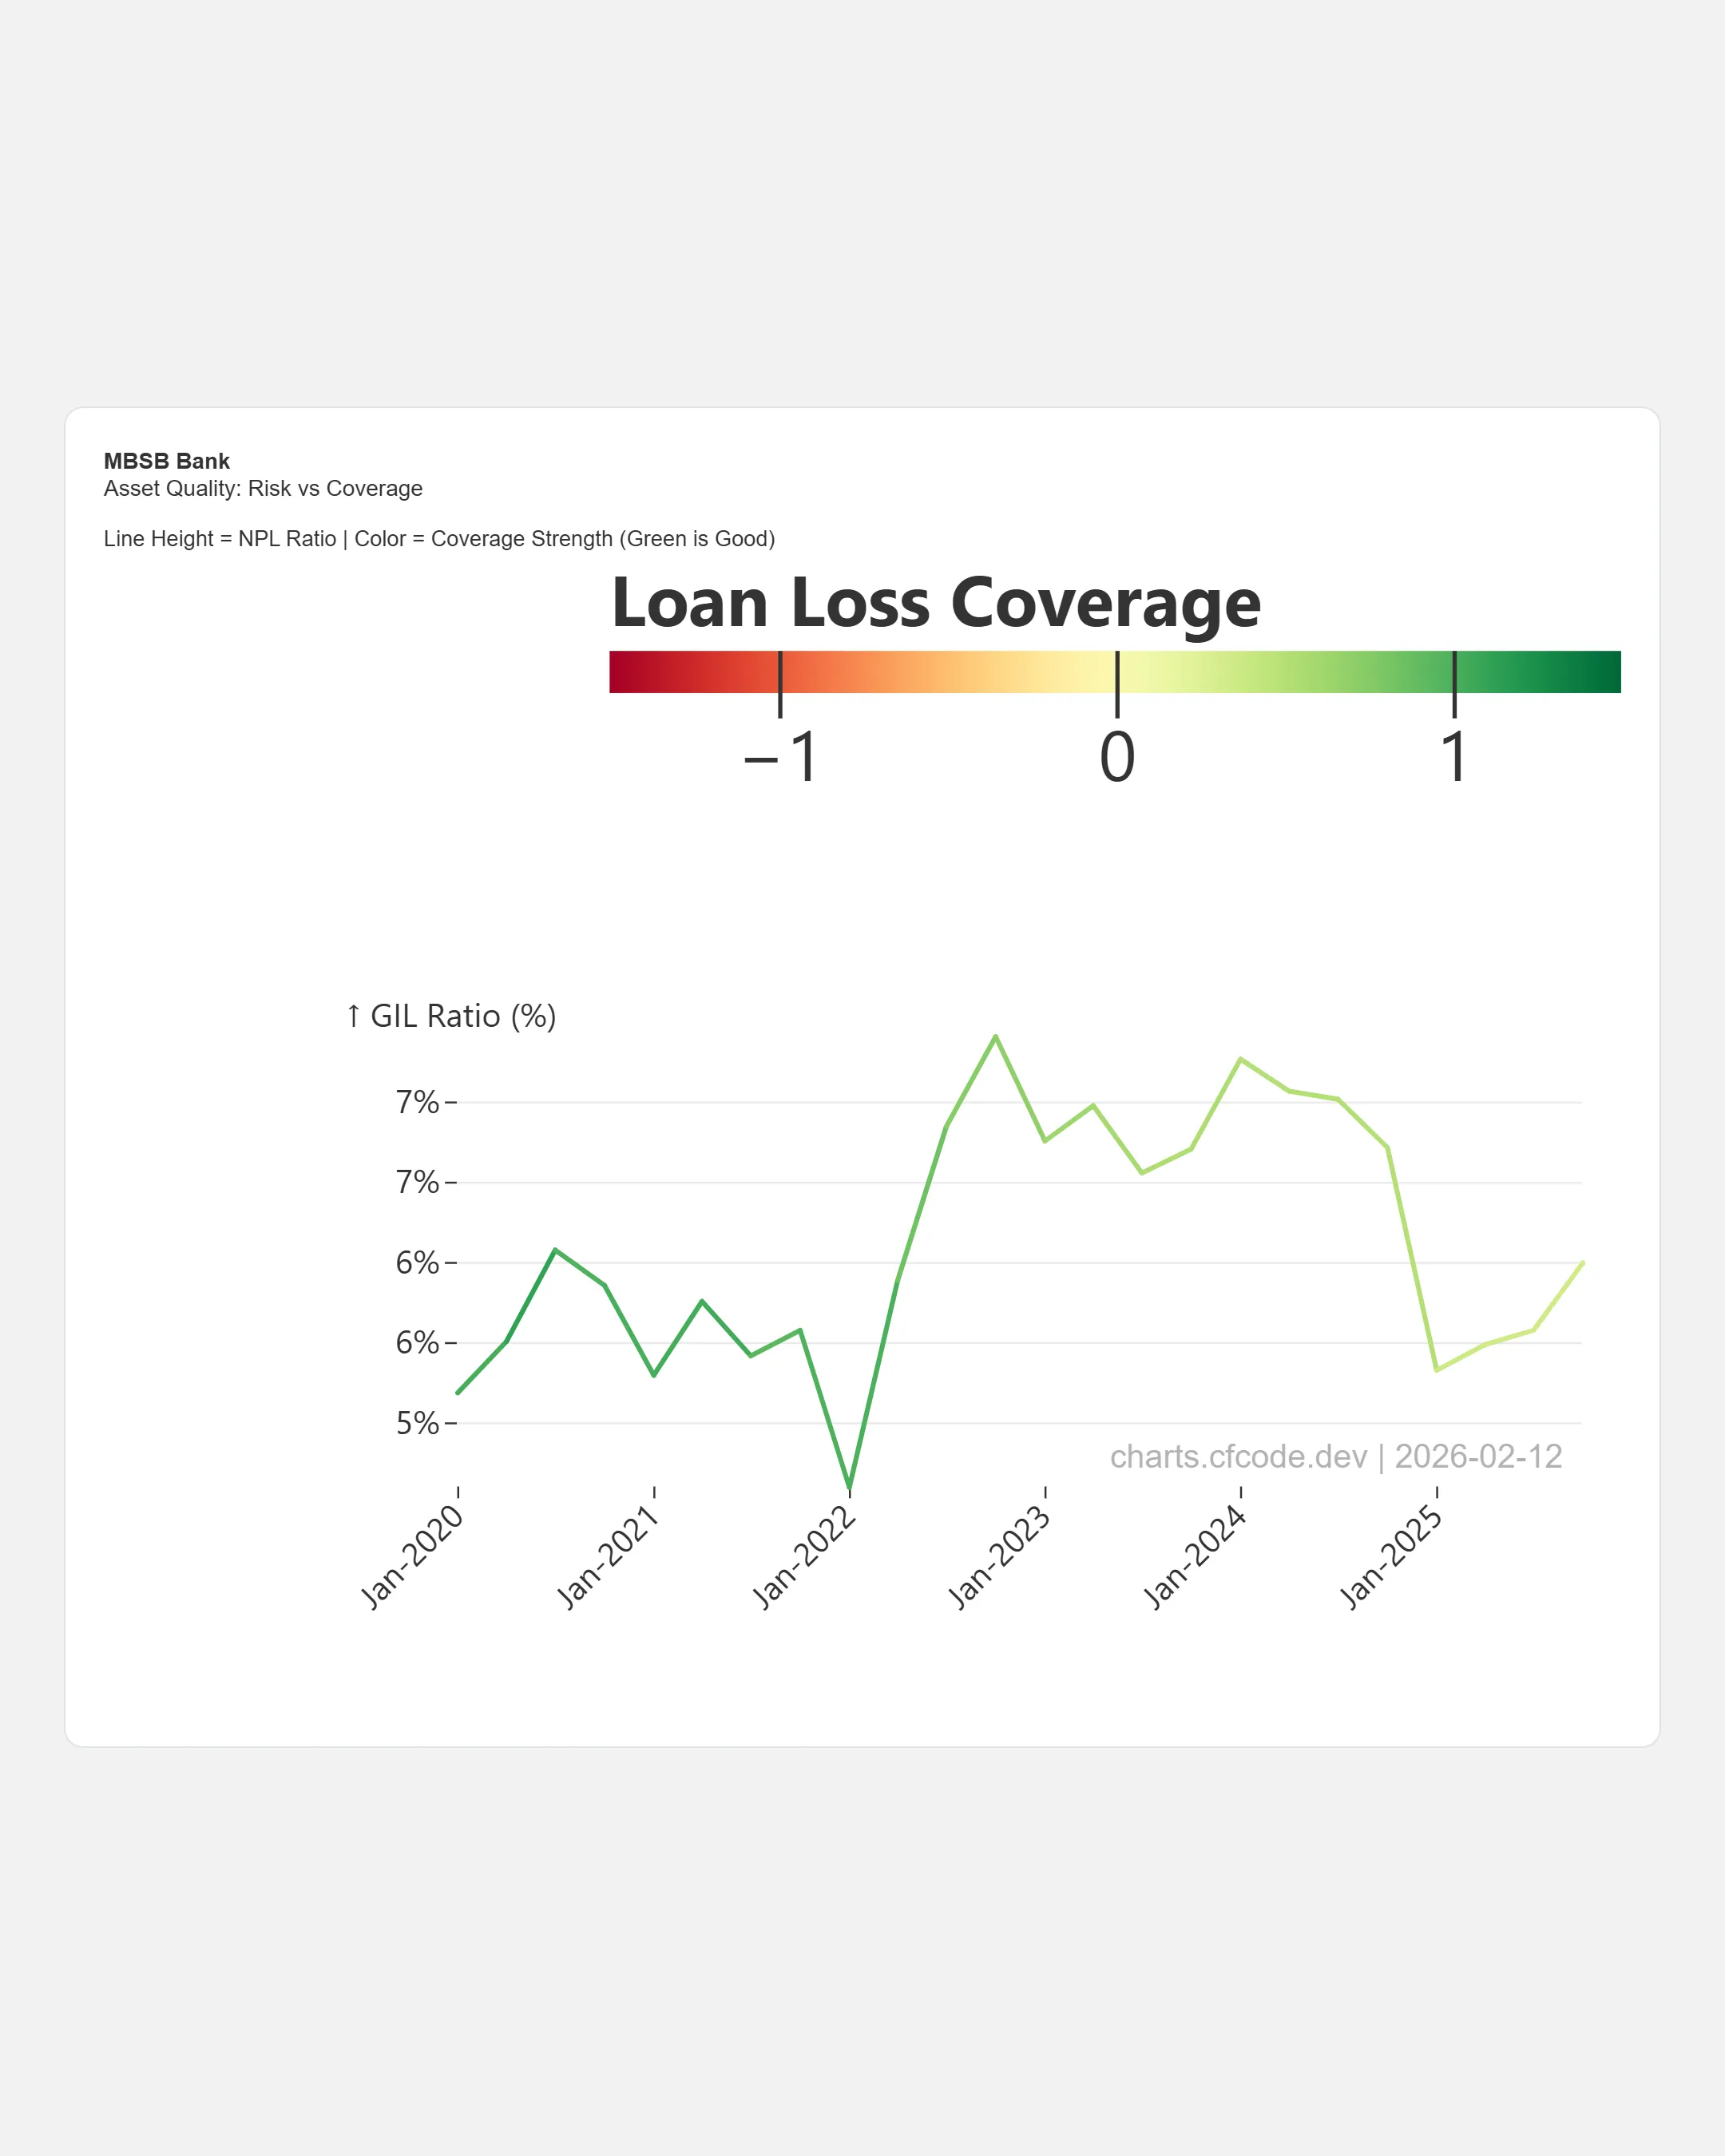
MBSB Bank still has a higher loan loss coverage ratio compared to its peers. It is the only bank that has the highest personal loans in its loan portfolio. It is slowly working to reduce that exposure, however.
And so on and so forth.
Are the banks expensive now? Can we derive any insights from the dashboard?
That is for another day.
Subscribe for my RSS feed or follow me on socials for more charts, insights and stories.
#IslamicFinance #MalaysiaBanking #FinancialAnalysis #DataVisualization #BursaInsights #EconomyMalaysia #BankingStrategy #AffinBank #Maybank #HongLeongBank #AllianceBank #AmBank #RHBBank